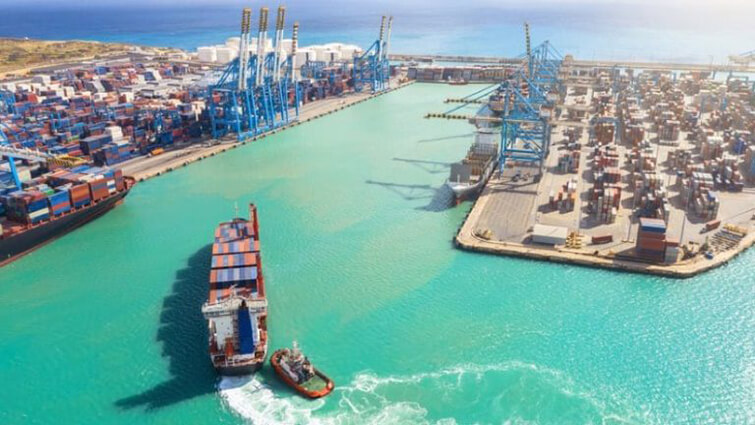
Two fundamental rules apply when navigating unfamiliar waters: reduce your speed and use all available tools to safely navigate the unknown. But at the National Oceanic and Atmospheric Administration (NOAA) Office of Coast Survey, the focus is on sustaining trade routes — where time is always a factor, even more so in a time of pandemic.
Work at the Office of Coast Survey centres on providing guidance to mariners in addition to surveying the seafloor, searching for underwater obstructions, making the nation’s navigational charts, and providing models for real-time coastal forecasts and warnings.
Within the Office of Coast Survey, the Marine Chart Division produces more than 1,000 charts with accurate depths and coastline to guide safe navigation for all 95,000 miles of US shoreline and 3.4 million square nautical miles of the US exclusive economic zone. Paper navigational charts haven’t been replaced by apps as quickly as paper road atlases were, and both technology and international law played roles in the slower adoption. But now, electronic navigational charts (ENCs) are becoming the reality.
NOAA recently announced plans to sunset the production of paper charts starting in 2020, with no new edition paper charts available after January 2025. Commercial ship crews saw this shift coming, but the announcement created a backlash with recreational boaters.
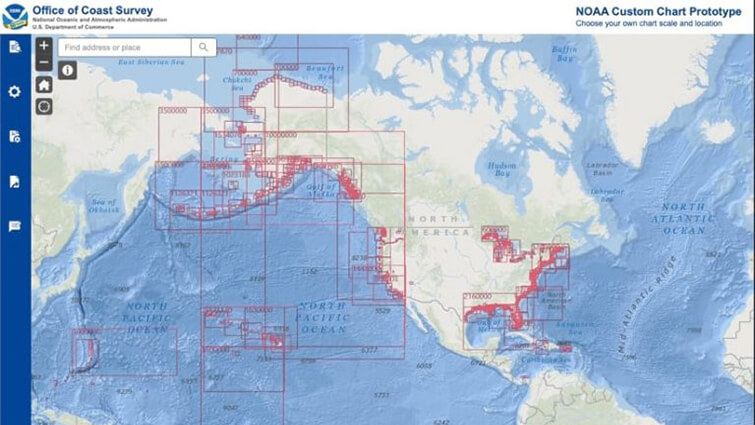
“The negative reaction is based on the idea that they can’t have a new paper chart, which is not the case,” said Captain Christiaan van Westendorp, chief of NOAA’s Office of Coast Survey Navigation Services Division. “Instead, we’re developing and implementing a custom chart application, which anyone can use to create and print their own paper chart using our data. Once we explain that, then they kind of relax.”
Paper Charts Legacy
President Thomas Jefferson first established the Survey of the Coast in 1807, which was reorganised in 1970 as part of NOAA (celebrating its 50th anniversary this year). Over the centuries, paper charts grew in detail and complexity as the agency worked to keep pace with coastal development.
As an illustration of this complexity, NOAA’s original electronic navigational charts required 130 different map scales to maintain coverage similar to the paper charts.
“Our charts are designed with the voyage in mind,” said John Nyberg, chief of NOAA’s Office of Coast Survey Marine Chart Division. “In the past, we fit the geography on a piece of paper with some overlap to give the mariner time to grab the next paper chart. The scale was often adjusted to fit all the details on a standard-sized sheet of paper.”
With the overlap and many scales, the original raster chart set has a great deal of duplication. It takes a lot of work to find and update any feature. If a navigation buoy is repositioned, for instance, its new location has to be marked on all the charts where it appears—at all scales and accounting for all overlaps.
This problem dates back to when NOAA created its first set of ENCs by simply digitising previously created paper charts. Most of its peers in the world’s charting agencies took this same expedient path, although they knew this would include inaccuracies present in the original chart. Now, NOAA is setting a new foundation for electronic charts that embraces digital advantages, including establishing just 12 standard scales that will speed map updates.
“We’re going through and rebuilding all the charts in phases and getting rid of inconsistencies,” Nyberg said. “For instance, in the Gulf of Mexico, we have charts that include all of the oil platforms, while an adjacent chart will not. We’re reconciling all of that to make sure we have the same quality of information on all the charts.”
Electronic Navigational Charts Reduce Uncertainty
All detailed measurements from NOAA’s survey operations about depth, coastline, and channel changes feed into a geographic information system (GIS). The new levels of efficiency that NOAA achieves by using GIS allow it to spend more time on improving the accuracy and quality of ENCs.
Simplified scales and database-driven GIS maps make it easier on the mapmaker, adding the ability to automate many manual processes. Mariners stand to receive information more quickly on electronic charts and have a smoother transition from scale to scale as they navigate.
NOAA has embraced the move to autonomous ocean surveying, the subject of a recent XPRIZE challenge. Shipping companies and ports are making the move to autonomous operations, and high-end recreational boats now have auto-routing capabilities. What’s crucial to this autonomous revolution is accurate and timely data delivery to the mariner.
The ability to quickly update electronic charts helps track areas that change frequently, such as turbulent waters near mouths of rivers where silt builds up into shoals or in areas of receding glaciers where large boulders can fall.
“People want an adventure on a cruise ship, and they want to get close to a glacier to see it calving into the water,” Nyberg said. “Our surveyors work to keep up with where ships are going, which is a challenge.”
Commercial Embrace of Electronic Navigational Charts
Advances in technology and workflows are giving mariners and surveyors time to do other things.
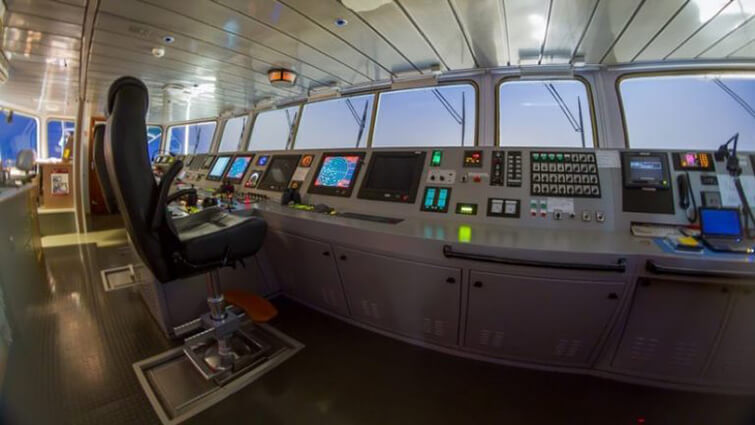
“When I started my mariner career over 20 years ago, we were using paper charts and fixing position with GPS or visual radar and plotting that on a paper chart every three minutes if we were near a harbour or near the coast,” van Westendorp said. “The whole navigation party was eight or nine people, and we knew our position every three minutes, but there was quite a bit of uncertainty between those points.”
Now, with GPS and electronic charting systems, position updates are instantaneous.
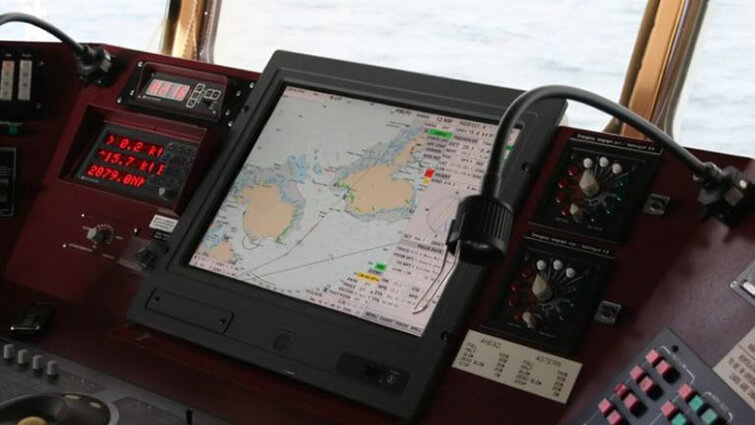
Larger commercial ships have made the move to Electronic Chart Display and Information System (ECDIS) technology that consumes ENCs alongside real-time information and position. The ECDIS was first approved in 2000 to meet the legal requirement of the International Convention for the Safety of Life at Sea (SOLAS) that ships above a certain size must carry charts. Its use is now mandatory for all international commercial voyages and is being phased in for existing ships. The quick transition to ECDIS is due to undeniable safety benefits.
An epic storm can rearrange everything that was once familiar about a port or channel, impacting even the most experienced mariner. The Office of Coast Survey now has the ability to update all charts weekly, making these changes available to millions of users through ENCs. With frequent ENC updates, proper seamanship, and modern tools, ship officers can navigate unfamiliar waters with confidence.
“Our raster sunset plan is a natural progression as part of the evolution of navigation over the past 20 years,” van Westendorp said. “Brand-new ways of doing things back then are now the way it is, and people can’t even conceive of doing it the old way.”
It’s hard to argue with faster, better, and cheaper.
“As a former paper chart mariner, I had some concerns about the transition,” van Westendorp said. “The new generation of mariners naturally migrate to electronic methods, so I did not fight this progress with my junior officers. Over time, electronic tools became our primary ones for planning and navigation processes.”
Pivoting to Update Charts from Home
The move to modernise workflows with an enterprise GIS approach has allowed the Office of Coast Survey to weather the shelter-in-place orders put in place to respond to COVID-19. When chart makers pivoted to working from home, they had the tools at their disposal to work as they would from the office, remotely keeping charts updated to protect safety at sea and promote efficient maritime commerce.
In this new paradigm, where social distancing is a critical intervention, the ability to work from anywhere is a central benefit of NOAA’s GIS transition. The same ability that allows users in the office to take charge and work alongside of each other in interconnected workflows has empowered a fairly seamless shift to working from home. Each chart maker can login to the known, controlled, and secure environment to use the latest and most authoritative data and processes just as they do in the office.
This article is written by Steve Snow and first appeared on the Esri Blog.
Learn more about GIS mapping and charting or get in touch with a member of our team on email or call +60 (3) 5022 0122 to speak to an Esri Malaysia specialist.